VSM Automatisering
UI UX design & Front-end development
EGAM
During my graduation internship at VSM Automatisering I researched the customer's needs regarding EGAM.
EGAM is a software package that helps farmers manage their livestock.
During the investigation it soon became clear that the user lacks information about his herd.
During the various discussions, a dashboard was therefore discussed, in which the livestock farmer can monitor his animals, import, remove and also medically monitor the animals.
At the analysis phase of the project we used best practice, a/b testing, focus groups and literature research to gather the information need to fill the dashboard. During this process we also look at data visualization and tested this with the user.
Within the goat sector, data is collected 6 times a day about the welfare of the animal. With this you can think of:
- The health of the animal
- When the goat enters lactation
- Milk production and milk levels
- What the animal ate and the amount
- The number of steps a goat takes per day
This means that there is a lot of data available from which we can form an analysis. I have therefore opted for a design in which the user can analyse, compare and monitor his various animals.
In addition, together with the IT team, I discussed the options for linking the milk values to the amount of feed. In this way, the livestock farmer can use about 40% of his feed better, resulting in less nitrogen emissions and better performance of the animals.
After my presentation of the concept to the livestock farmers, everyone was very satisfied and curious about the effect of the product. After giving this presentation, I immediately started working on the prototype and testing the prototype with the user.
This was done as early as possible because there is little knowledge of computers and related equipment within the agricultural sector. The testing and the process was therefore quite a challenge.
In addition, the target group was very large and generic. From an employee of the livestock farmer to the vet who wants to view and assess the data of the livestock farmer. The target group therefore varies greatly in education level and type of work.
During this process, tests were carried out 3 times a week and these tests were discussed within the focus group.


Dashboard
It is important for livestock farmers that they can see at a glance how their livestock is doing. That is why the landing page has become a dashboard with all the necessary information for the farmer.
The use of pointing tooltips has resulted in less cognitive load. This is very important within a complex application such as EGAM.
Input of different values
Enter data
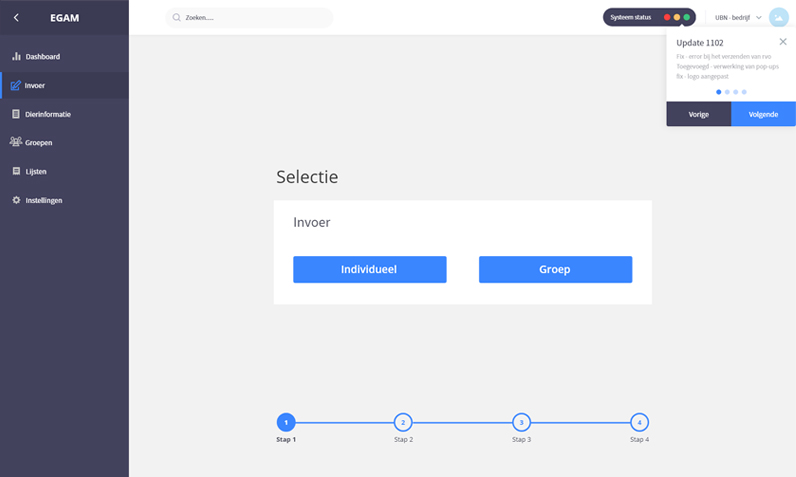
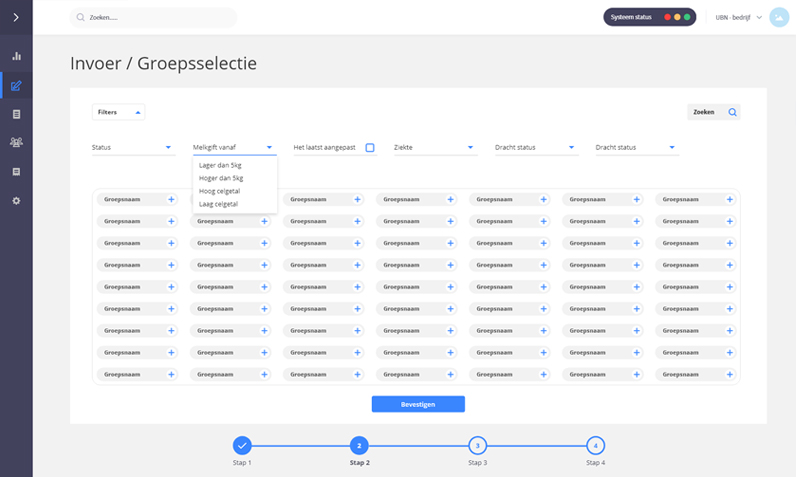
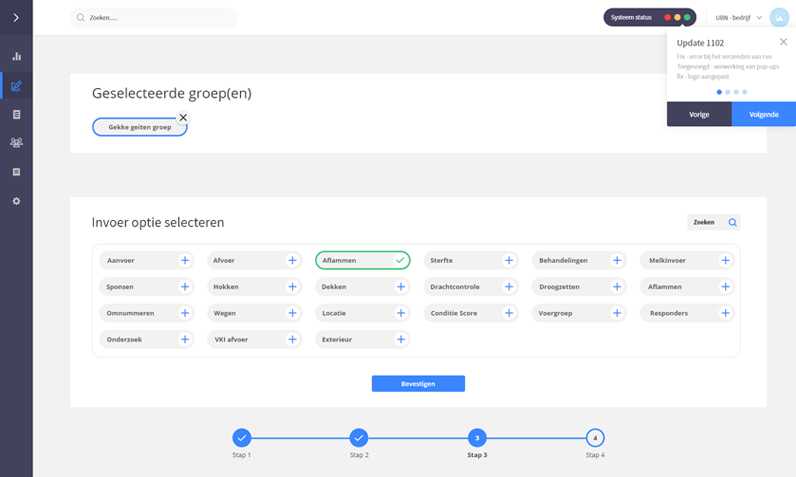
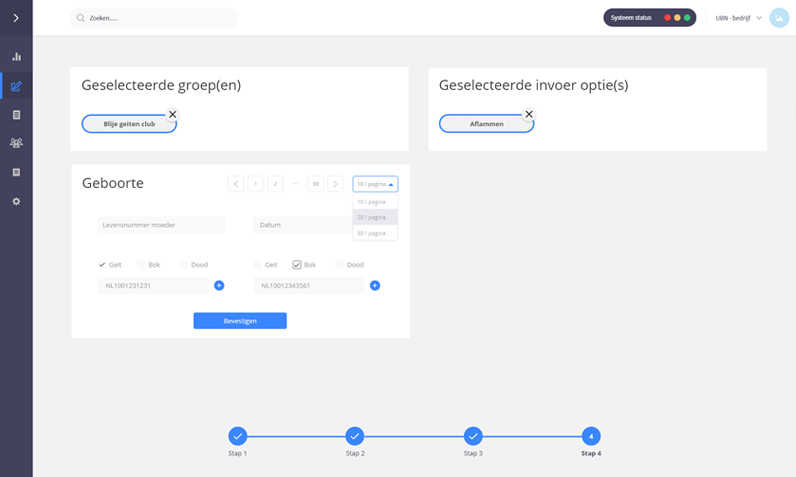
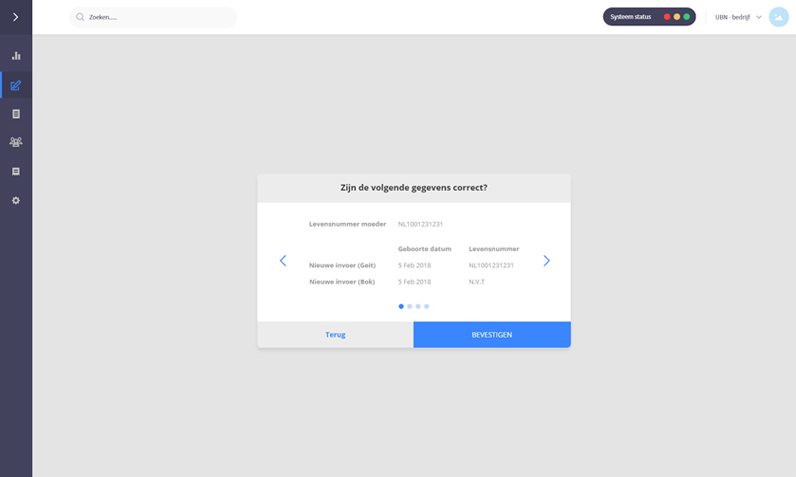
It is important for the user that they can enter their animals within the system. Various data is collected here about the welfare of the animal, but also the actions on the animal.
A clear step-by-step plan has been chosen to guide the user through the complex system. After testing the prototype, it turned out that the user likes the option to add multiple actions at the same time.
Create lists
Create lists
Create lists
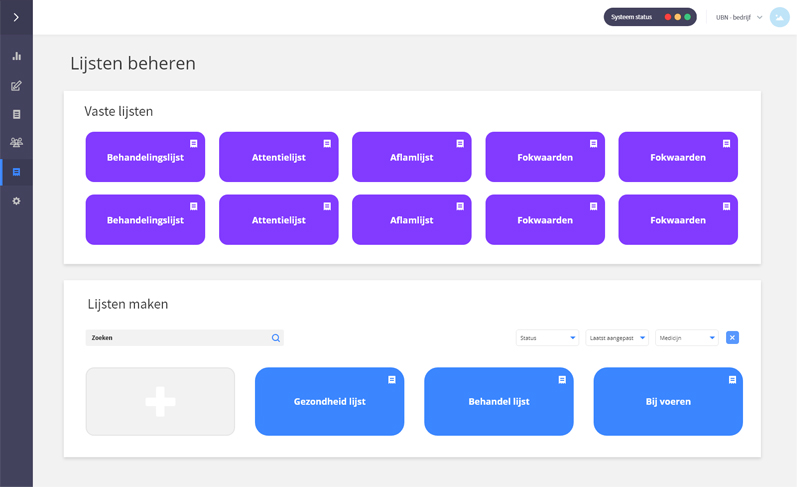
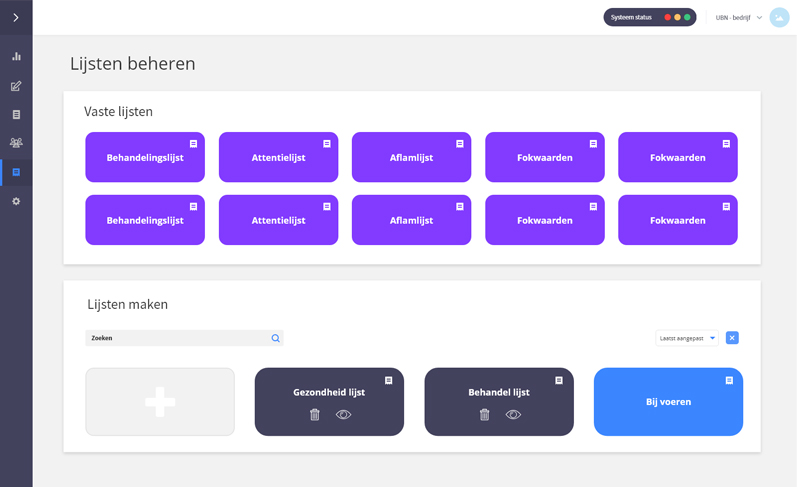
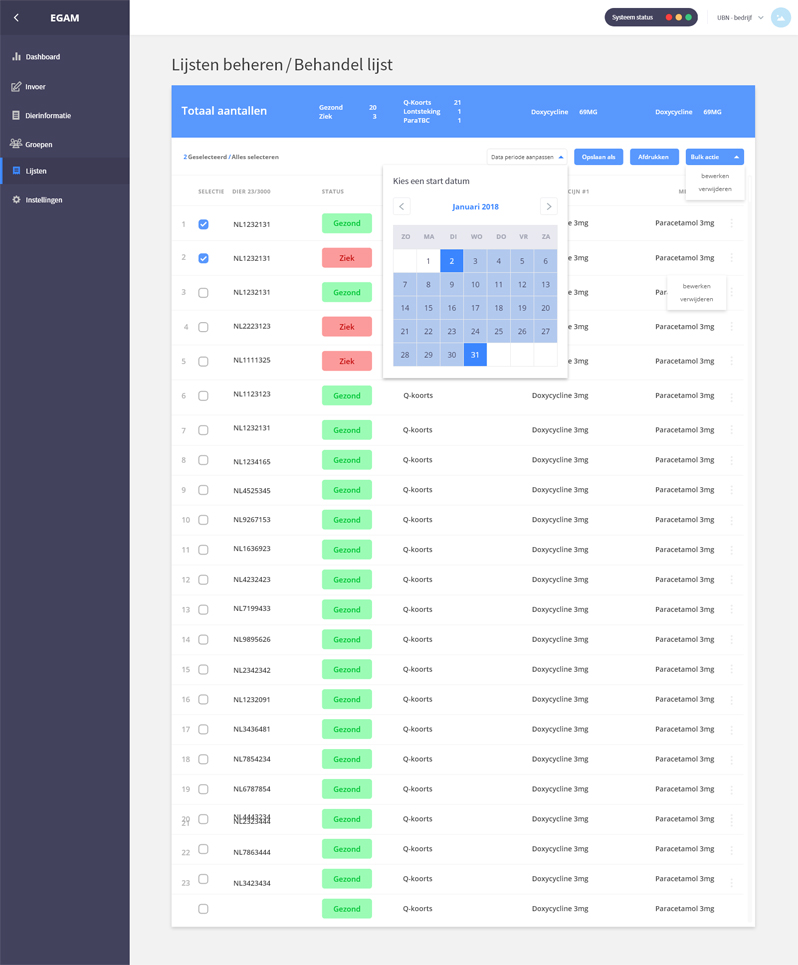
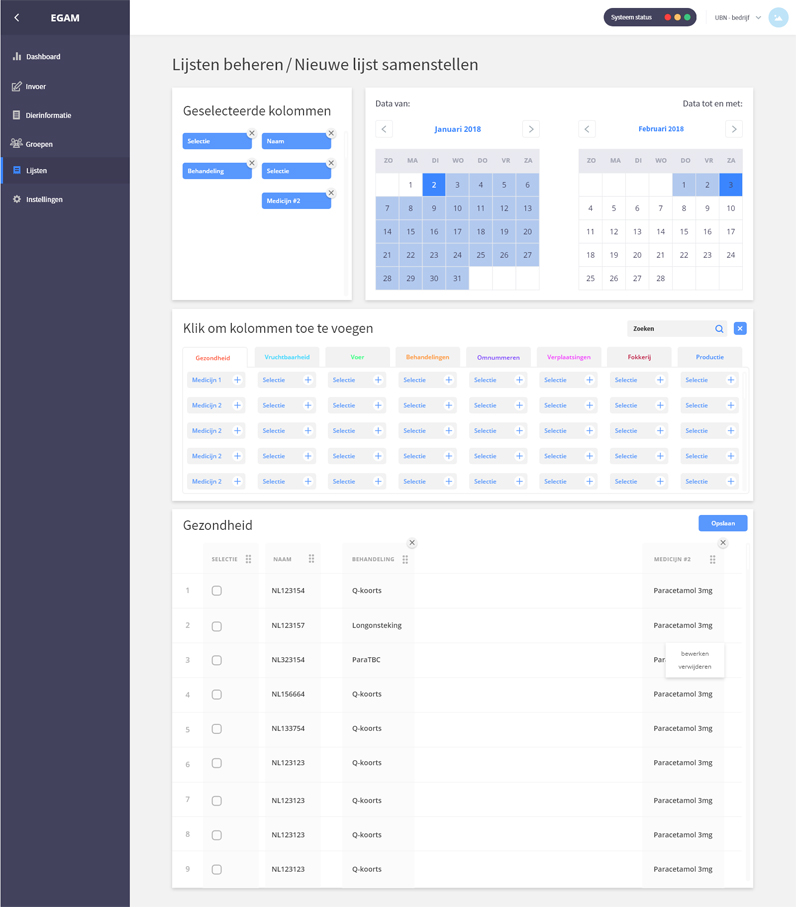
It is important for the user to be able to make lists with raw data. As livestock farmers, they are obliged to share certain parts of the data with the government.
In this way the emissions are measured and, for example, the registration of an animal if it was born or died.
In addition, this way the user can compare his animals on values that they determine themselves.
Create groups
Create groups
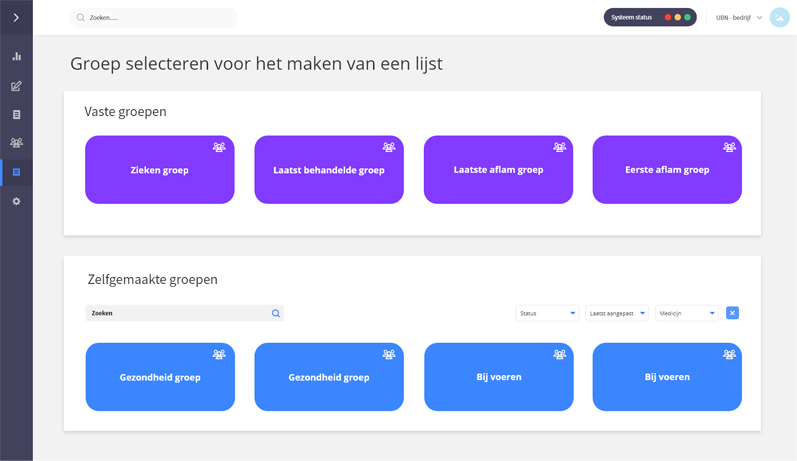
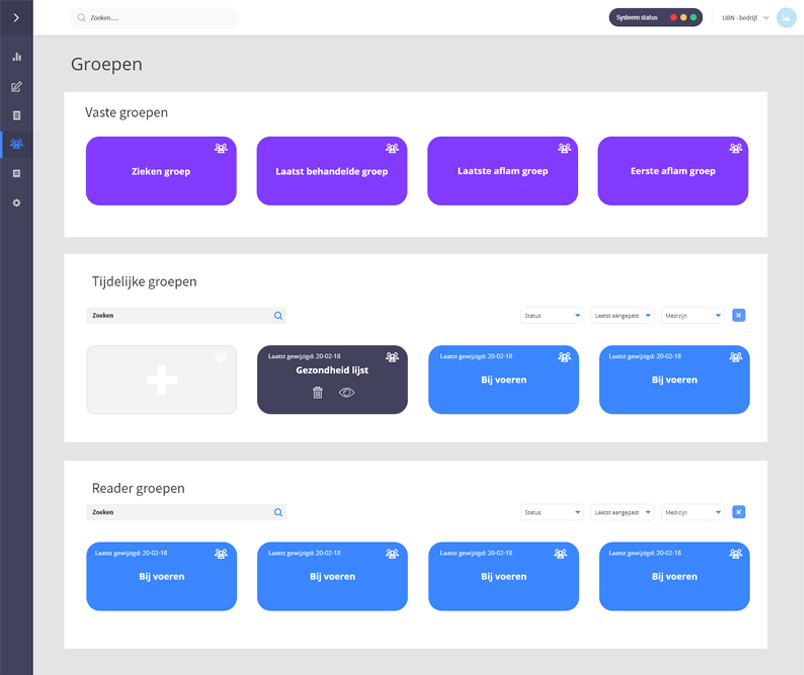
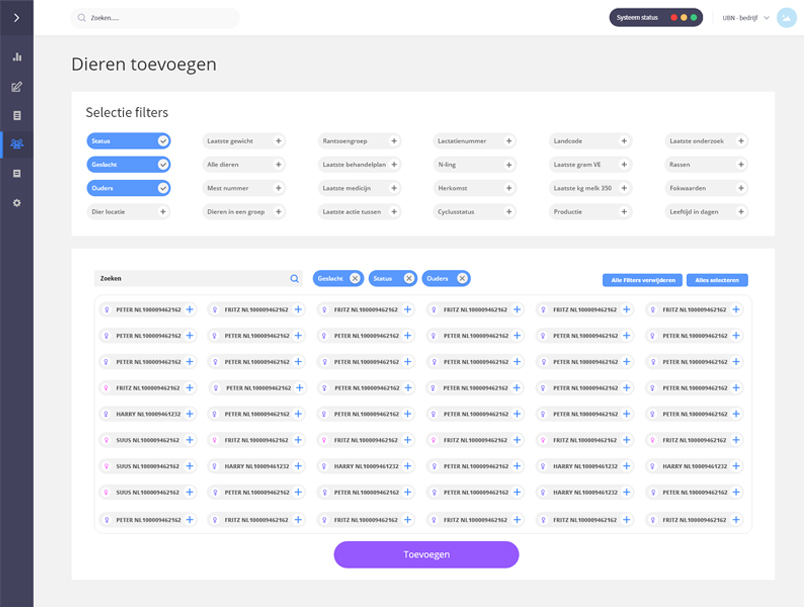
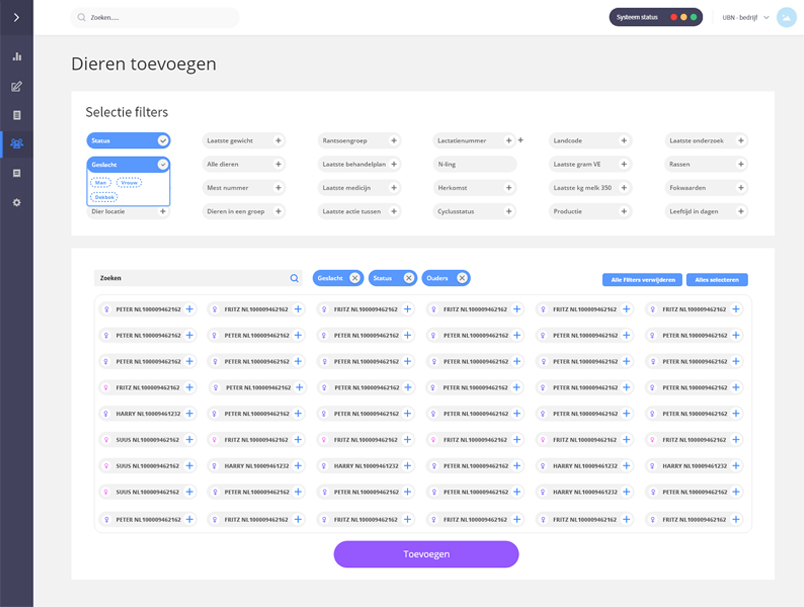
It is important for the user that they can use groups when creating lists. In the current system it is not possible to create groups. This causes the user to select and re-enter approximately 200 animals at a time for each operation.
It was decided to create groups based on the data we have. The user can sort on all values available about the animal. In this way the user can create a dynamic group and make his own queries by selecting filters.
During the research I found out that making groups makes a big difference for farmers. Through the Using groups, the farmer needs about 60% less time when entering the animals and the underlying administration.
The various choices that have been made are the result of a/b testing and contact with stakeholders and users within the focus groups.
Style Guide
Style Guide
During my graduation I was the only UI & UX Designer within this project. For this reason I have chosen to make a style guide for the web development team. In addition, I have worked out several pages with StencilJS. With StencilJS you can create web components that have a certain generic styling.
In addition, you can adjust these web components by adding properties. In this way the design remains consistent and within the style frameworks that have been determined.
